In the previous blog entry we paused for a brief mental recap of our journey thus far. We are ready to move forward to more functionality within our module such as adding tasks. Though before we get to that we should cover an important concept that all developers needs to know about... and that is debugging!
When developing a DNN module (or any application for that matter) there comes a time when the developer needs to debug the application. Something may be going wrong, the app may be throwing an error, or just unexpected data may appear and we need to get to the bottom of it to see where our program is going wrong. The process of this investigation is referred to as debugging. At a high level debugging usually follows the common pattern of something going wrong, setting a breakpoint, then reloading and hitting the breakpoint, then investigating.
There are different methods of debugging and the varying ways of debugging are usually related to the type of application you’re building. We’re going to review the way a lot of DNN module developers go about debugging. I’m sure there are even more ways of debugging that I’m not aware of so if you are a skilled developer reading this please let us know how you debug in the comment section below.
Release Mode vs. Debug Mode
Whenever we want to debug in DNN we must first build our module in debug mode. We previously discussed building our modules in “release” mode in order to create our module packages (for installing). In order to debug just click the same drop-down and change it to debug mode.

PDB Files
As a side note I’ll mention that anytime we build in debug mode a special .pdb file gets placed into the bin folder. If you remember we discussed earlier that whenever we build our module a new .dll file gets placed into the bin folder of our site. Building in debug mode places this pdb file in our bin. PDB files stand for “program database” and these files hold debugging and project state information. The below screenshot shows the bin folder after building our module in debug mode. Notice how the .pdb file sticks out a little from the rest of the files.

Debugging our “MyFirstModule” Module
So let’s actually debug something in our module so we can get hands-on experience. Open the “webservices.cs” file. We’re going to put a breakpoint on the line that reads return “Request.CreateResponse(HttpStatusCode.OK, tasks);” so that we can investigate the objects that are getting returned by our TaskController class. If you remember the previous issue we had where the TaskName and TaskDescription fields were coming back as “null” this method of debugging could have helped us investigate that very issue. Though, in that scenario we were able to figure it out even before debugging via breakpoints.
In order to add a breakpoint click in the far left margin of the editor and you should see a red dot come into view. This represents a breakpoint and should look like the below:

Once you get the breakpoint set we then need to build our solution in Debug mode. So select the build dropdown from the top and place into “Debug” mode and then right click on the solution and click “Build Solution”. Again you can verify that the module was built in debug mode by noticing the .pdb file in the bin folder.
Attach to Process
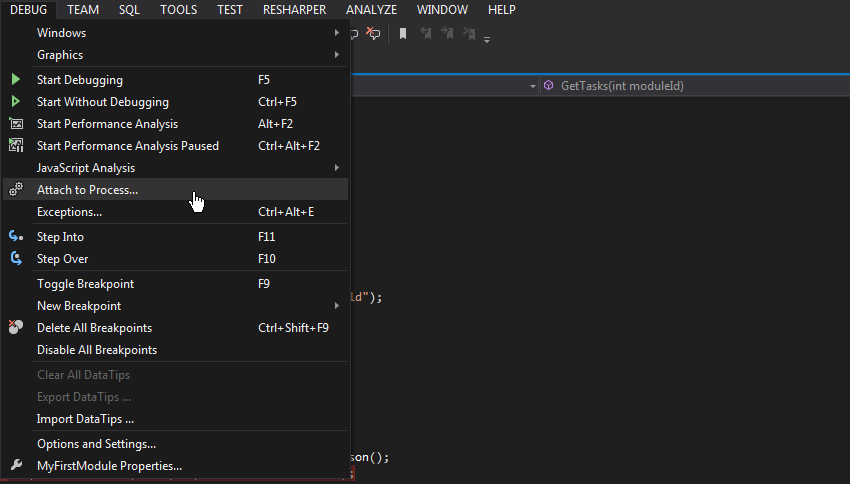
After you’ve built your module in debug mode we then need to take an additional step. We need to attach to the w3wp process. In order to do this click on the “Debug” menu item at the top of the screen and about half way down you will see an item titled “Attach to Process”. Select that item.

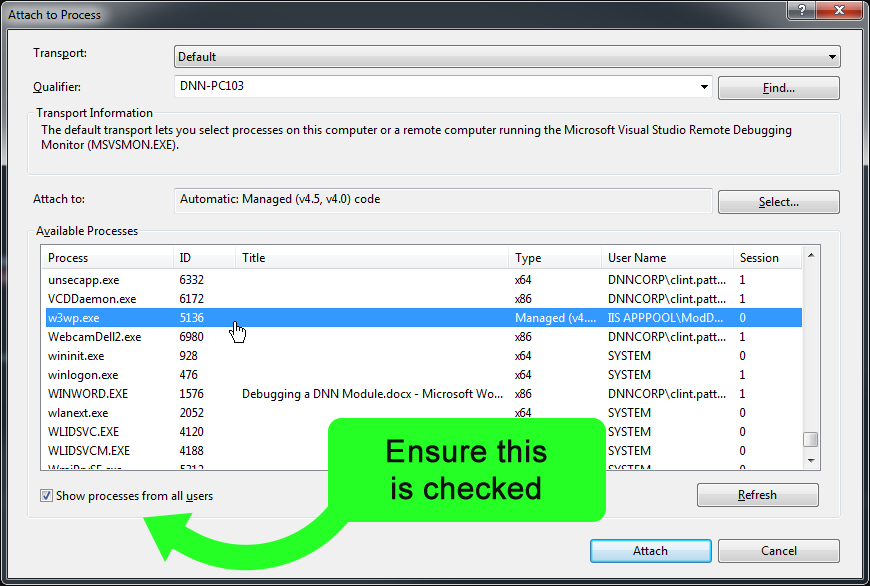
You will then see a pop-up box with a bunch of process that you can select. We need to select a specific process called the “w3wp.exe”process. Note that if you do not initially see the w3wp process then be sure that the “Show processes from all users” option is selected.

Select the w3wp.exe process and then click “Attach”. Also notable is it’s possible to have multiple w3wp processes running at the same time. This would happen if you were running multiple sites on your local machine. Be sure to select the w3wp.exe process for the site we are developing against in this series. After selecting the w3wp.exe and clicking “Attach” you may be prompted with an “Attach Security Warning”, if you are just click “Attach” again and you’ll be good to go. Now we are ready to debug. Before we do anything though I want to point out that you can always stop the debugging at any moment via the debugging menu at the top of the Visual Studio screen. Now visible is a light blue pause and a light red stop button.

Now that we’re in debugging mode we are ready to proceed. What is going to happen in the next few moments is that we are going to refresh our web page and whenever the breakpoint is hit then Visual Studio will stop our program and hold it right on the breakpoint. So go ahead and refresh your browser and see if your breakpoint is hit. When the breakpoint is hit then you should see the breakpoint line highlighted in yellow.

Now that we’ve hit our breakpoint notice that there are more debugging menu options available at the top of our window such as the “Step Into”, “Step Over”, and “Step Out” options. These menu items will give us even more control if we need to step through our code line by line to see exactly when something is happening.

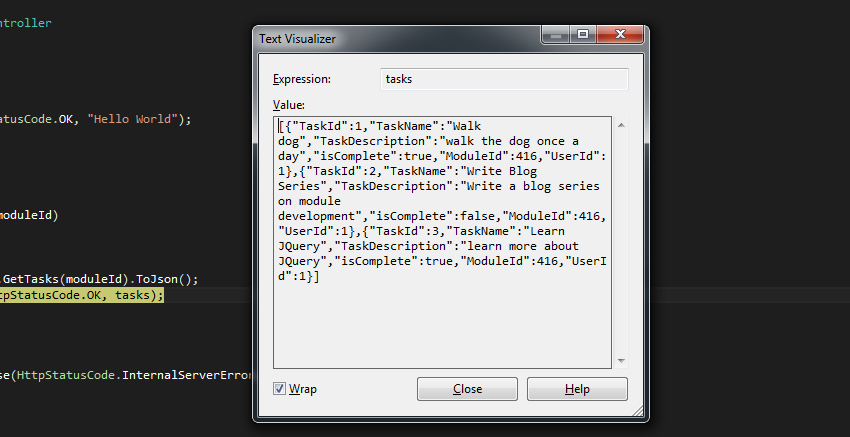
Now go down to the breakpoint and hover over the tasks parameter that we are passing into the response. You should see our array of objects.

Notice that we can also click on the magnifying glass and open the “Text-Visualizer” to see the entire array in a more easily readable format.

If you ever have an issue within your code and can’t figure out what’s going on setting a breakpoint is a great way to investigate. You can also notice even more information in the “Watch” panel and “Call Stack” areas at bottom of Visual Studio. I encourage you to click the “Step Into, Over, & Out” options at the top to get familiar with stepping through code.
I’m now going to click the stop button to stop debugging. To remove the breakpoint simply click on the red dot on the left hand side and the breakpoint will be removed.
FIDDLER
While the majority of our debugging will most likely occur in Visual Studio we can also use external tools to help us debug our application. “Fiddler” is an example of an external tool that we can use to help us debug. Fiddler is an HTTP debugging proxy server application. It captures HTTP and HTTPS traffic and logs it for review. If you want you can download Fiddler. We’re not going to really review how to use Fiddler in this tutorial, but I did want to make you aware of this program.
The below video walks through the concepts covered in this blog entry
Summary
I hope this quick overview of debugging your DNN module has been informative. Of course we could dive way deeper into debugging, but at this point I think it’s important just to know what it is, where it resides, and how to do it at a high level so that we can dig deeper at our own pace. I’ve also provided some helpful links below in case you do want to know a little more about debugging.
Helpful Links
In the next blog entry we’ll walk through the process of adding tasks to our task list. Hope to see you there!
Go To The Next Blog Entry: Adding Tasks