Introduction
SQL Profiler is a great tool to find out the SQLs being executed by your application. It comes very handy in troubleshooting customer issues.
Disabling Host Scheduler

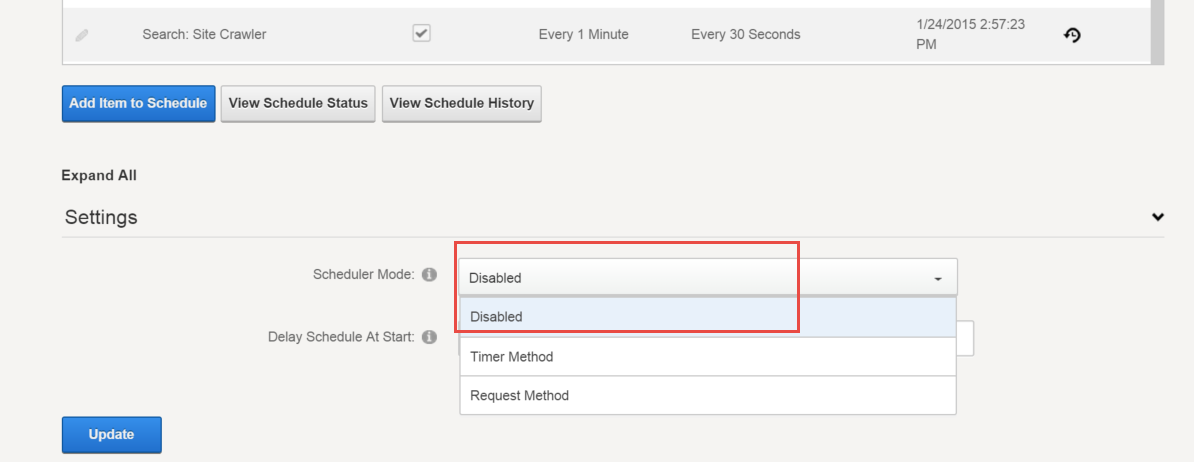
DNN comes with a Scheduler that allows various background tasks to execute at different frequencies. Depending on the frequencies defined, Scheduler can pretty much run ay time, and as a result you can see several SQLs running in your profiler. It is advised to disable the scheduler while running the SQL Profiler so you can focus on your SQLs only.
Go into Host > Schedule > Settings section > Select Scheduler Mode as “Disabled” and click Update
Launching

SQL Profiler can be launched from SQL Server Management Studio through Tools > SQL Server Profiler. It can also be launched directly from Windows also.
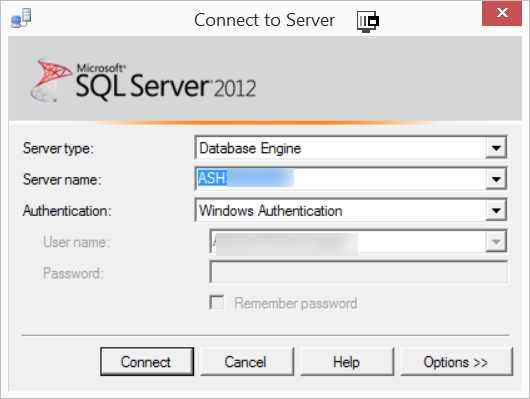
Connect to Server

Select the server you want to connect
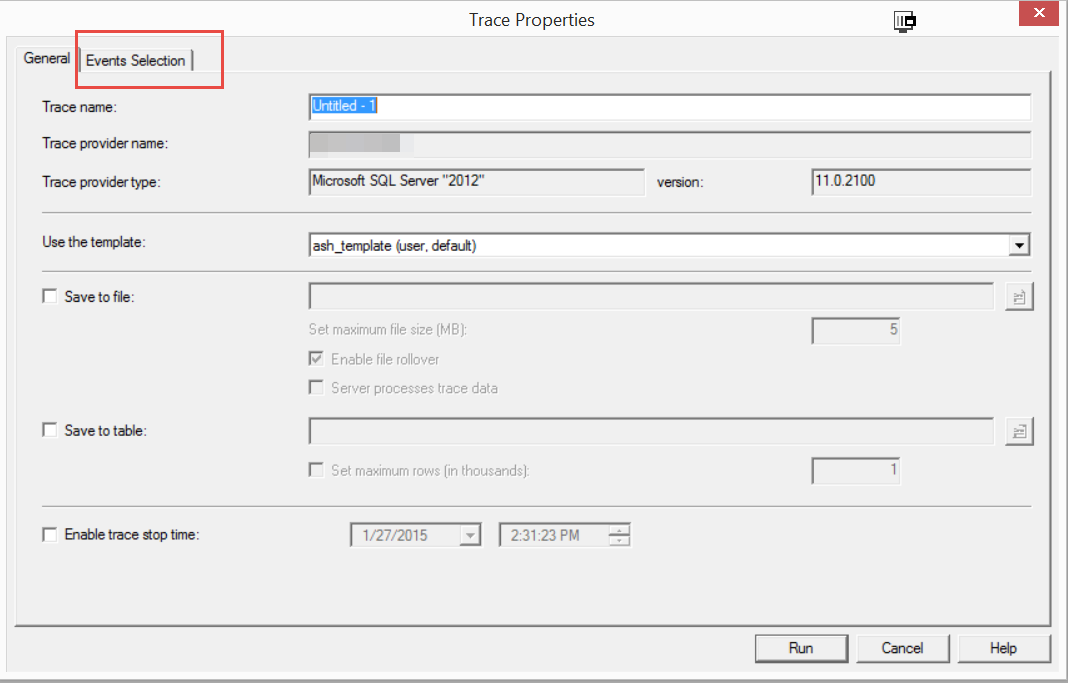
Trace Properties

By default SQL Profiler produces a lot of information, we need to exclude many of those. On the “Trace Properties” dialog, select “Events Selection” tab.
Events

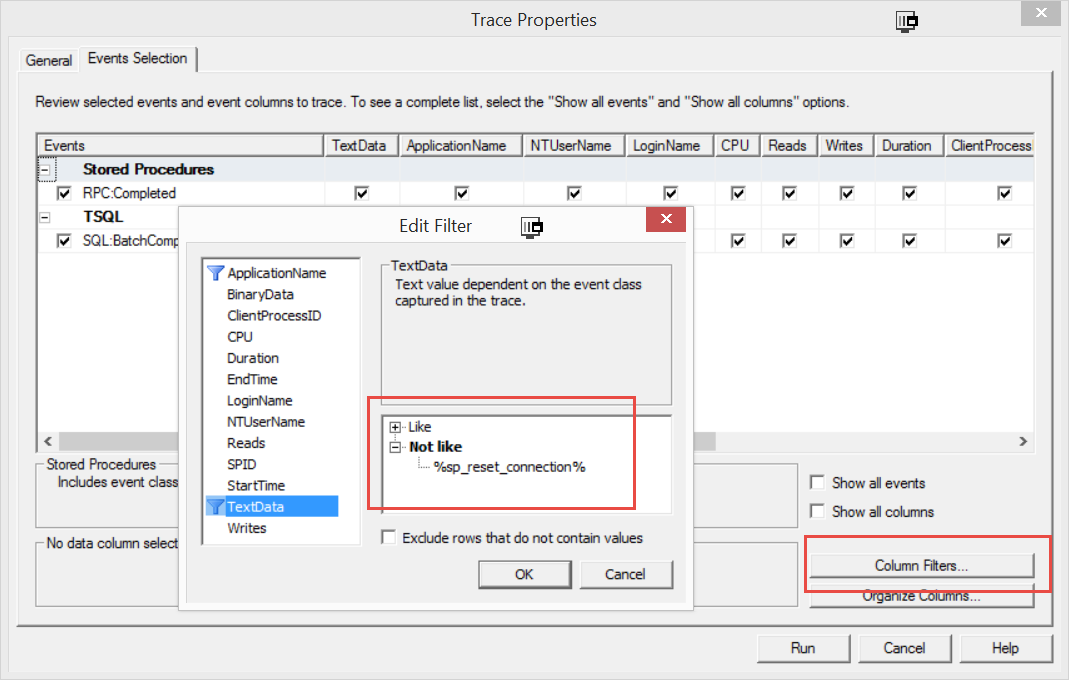
Unselect everything and make sure only “RPC: Completed” under “Stored Procedures” and “SQL:BatchCompleted” under TSQL is selected. Ensure
Column Filters

Click on the button “Column Filters” to launch “Edit Filter” dialog. Now select the “TextData” item from the list and edit the “Not Like” area. Add %sp_reset_coonection%. Note the “%” before and after, they are both needed. This is instructing SQL Profiler to exclude all the records that have text “sp_reset_connection” text in the column TextData. This should remove lots of redundant records.
View the Trace

Once you save the above filters, click on Run to start getting the Trace. You can actually copy paste the exact call and run in SQL Server Management Studio. Now you need to do an action on the browser that can generate the SQLs, e.g. refresh the page where your module is located.
Caution
Please note that running SQL Profiler can result in performance penalties, so it is advised to run it for smaller period of times in a production environment.