Recently we decided to upgrade a few servers that were part of our web infrastructure. The old servers were originally purchased in 2009 and had been used extensively for various production web properties, and after years of service packs the system volumes were running extremely low on disk space. As a result we decided that it was a good time to purchase some new replacement servers. To try and mitigate any migration issues, we planned to keep the configuration on the new servers as similar as possible to the configuration on the old servers. Essentially this meant that we would use the same amount of RAM ( 8 GB ), same number of App Pools, same number of sites, etc...
We set up the new servers and migrated all of the configuration and websites to them. We then tested the functionality of the sites internally and they appeared to be working fine. So we promoted the new servers to production... and immediately we began to experience problems.
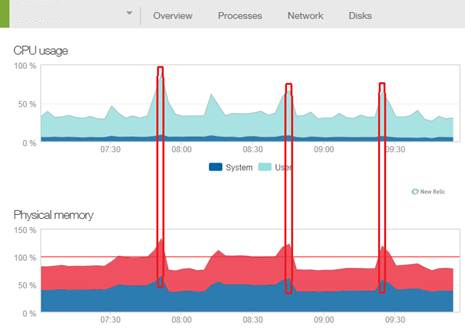
Most of the websites had no issues whatsoever on the new hardware. However, the largest and most critical website had a major issue. It would perform well for a period of time and then they would slow to a crawl resulting in a terrible user experience for visitors. The RAM and CPU on each server would spike and the website would stop responding. The only resolution was to manually recycle the app pool. The performance was inconsistent and unpredictable and there was nothing obvious that could be identified as the source of the problem. We could have rolled back to the old servers immediately but this would have impacted our ability to try and effectively diagnose the issue - as it was not occurring during our internal testing. Using all of the expertise and tools ( ie. New Relic, Nagios, Google Analytics, IIS Logs, Perfmon, etc... ) at our disposal we tried to identify the problem but were unsuccessful. So ultimately we rolled back to the old servers in order to achieve stability.
However this was not a solution - we knew we still needed to find a way to migrate to the new servers. But we first needed to try and reproduce and diagnose the problem. In an effort to try and simulate the traffic in our production environment we utilized some load testing tools to try and reproduce the performance issues on the new servers. We varied the number of clients and duration of the load tests but could not recreate the problem. We checked and rechecked the configuration, and even spoke to a few independent consultants but could not find anything out of the ordinary. The only plausible suggestion was that the server did not have enough RAM - but even this did not make sense because the new servers had the same amont of RAM as the old servers. We decided to invest in more RAM ( an additional 8 GB ) as the common belief is that you can never have too much RAM. Since we could not replicate the issues in testing we began to think that initial migration issues may have been an anomoly. So eventually we decided that we needed to attempt another migration to production.
The second migration resulted in the same results. The main website had serious performance issues that badly affected the user experience. Since we were running in a web farm it only affected a portion of the visitors at any given time, but the overall stability was still unacceptable. The server was still experiencing spikes in CPU and RAM and the only way we could keep it under control was to configure IIS to recycle the app pool automatically if it reached a specific RAM threshold. But this was not a long term solution.

So we continued to try and diagnose the issue in the production environment. We looked at the behavior of the DNN application. There seemed to be a pattern to the CPU and RAM spikes - they were occurring roughly every 20 minutes and resulting in an app restart. So we focussed on the scheduled jobs running on the site. We disabled the jobs but it had not effect. The other thing we noticed in New Relic was that there was a lot of network traffic during these events. So we looked at search engine indexers, bots, etc... but again could not find anything out of the ordinary. We looked at our web farm configuration and the behavior of the WebRequestCachingProvider but it also appeared to be behaving appropriately.
Eventually we dug deeper into the application restart events. We originally thought they were happening because a runaway process was consuming so much memory that it would exceed the RAM threshold and IIS would restart the app pool. However, we then noticed that the application was registering multiple app start events at these times. These were appearing in both the Windows System log and the DNN application log. We made some modifications to our Log4Net configuration and we were able to identify that multiple app domain threads were being spun up at app start - sometimes as many as 15. Most of these threads would not live for more than a minute before they shut down and a single thread became the sole survivor. We did some research into this behavior and found out it should never happen unless you are using a web garden ( which we were not ).
So we contacted the ASP.NET team at Microsoft with our issue and they suggested that during the app start process, perhaps there was something in the application which was causing additional app restarts. So we modified Log4Net to capture the detailed Application End event information and discovered that the application was reporting many different reasons for threads shutting down - modification of web.config, app_code class file changes, bin file changes, resource file changes, app_browsers changes, etc... We knew for a fact that DNN was not touching any of these files so Microsoft suggested that we look for other applications that may be accessing the files for the site. The only suspects were the Anti-Virus service and New Relic - but we could not find any evidence to support this.
So usually the best way to troubleshoot a problem that exhibits itself in one environment and not another is to try and identify any differences between the environments. We thought we had already done a thorough job of this but decided to take another look. We focussed on the one area which we had not examined before - the system registry. And in fact we did find a difference. On the old servers we had a custom setting for ASP.NET - a key named FCNMode.

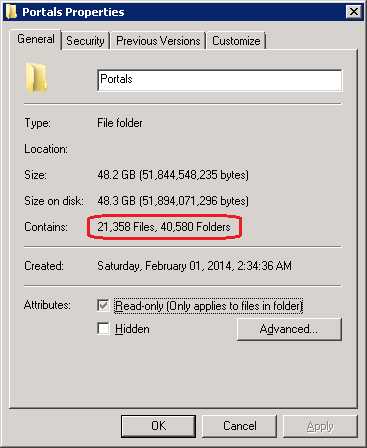
FCNMode stands for File Change Notification and it controls how ASP.NET monitors a web application for changes to files - notably files that may require an app domain restart. By default FCNMode creates a monitor on each individual folder within a web application. So DNN is a very dynamic application that manages a lot of content assets on the file system. And each user has their own dedicated folder where they can store their profile photo, etc... So this means that there are many folders which exist within a DNN application. In the case of the site with the performance problems there were 40,000 folders ( because the number of community members was very large ). So this meant that ASP.NET was trying to create 40,000 folder monitors every time the application started.

FCNMode has a custom setting for "Single" (2) which was present on the old servers. Single mode means that there is single folder monitor for the entire application, regardless of the number of folders. So we made this registry change on the new servers... and immediately the CPU and RAM spikes disappeared!
Deeper investigation into FCNMode reveals that with the default setting, FCNMode creates a monitor object with a buffer size of 4KB for each folder. When FCNMode is set to Single, a single monitor object is created with a buffer size of 64KB. When there are file changes, the buffer is filled with file change information. If the buffer gets overwhelmed with too many file change notifications an “Overwhelming File Change Notifications” error will occur and the app domain will recycle. The likelihood of the buffer getting overwhelmed is higher in an environment where you are using separate file server because the folder paths are much larger.This is the case in most DNN web farms.
I am sharing this information because I believe it will provide value to anyone who is struggling with strange DNN performance issues in larger DNN deployments. The next version of DNN will include an FCNMode of Single by default in the web.config ( as long as you are running ASP.NET 4.5 ).