As systems become more interconnected and consist of many small parts over a monolithic mass, one of the difficulties becomes understanding how they are running and where issues might be appearing. For our OnDemand product, we have a combination of individual customer installations coupled with our management systems. Each individual system runs on dynamic cloud resources, and log files and metrics are generated at the hardware, OS, database, web server and application level.
Distributed systems have their benefits but when investigating issues the distributed log and metric streams make it hard to tie together a coherent picture.
Through our working relationship with Microsoft Azure, we started to work with Application Insights. By working to integrate the various log streams of our systems into Application Insights we could gain a point-in-time view of requests, exceptions, metrics and more. The Application Insights UI in the Azure Portal can provide this data in graph view or in text format using search and filtering.
While Application Insights has proved an invaluable resource for looking at the performance of an application, what it lacks is a way of performing deeper analysis of that data in a more powerful way. Microsoft introduced us to a new feature of Application Insights called Analytics, which gives us access to the Application Insights data, but in a way where we can write our own queries, perform visualizations and export to Business Insights for further analysis.
Application Insights Analytics provided us with the missing part of the equation for being able to combine, sort, query and filter data as we needed. Allowing our team to use their own ingenuity and experience to find data with a powerful query language has allowed us to find insights and solve problems we didn’t even know we had. The query language available with Application Insights Analytics is similar to SQL Queries. A lot of interesting answers come from the questions starting with ‘I wonder if…’ – when you can write a query to express that question against the data, you will get the interesting answer to match. Sometimes the relationships might not be plain until you visualize them, so being able to transform those interesting answers into interesting graphs with a single click provides another dimension.
A concrete example of this was when we were faced with an issue where a site was performing badly at or around a specific time of day. If faced with diverse log file locations and formats and buried metrics data, this would be a difficult situation to catch and solve. By constructing a query which combined CPU metrics, Server Instances, Web Requests and the Dnn Event log into a single results set, we could isolate the types of requests and exceptions occurring along a specific timeframe. It was then a case of understanding the type of traffic that was creating the exceptions which led to high CPU. Drilling into this traffic it became apparent that Synthetic (i.e., bot) traffic was hitting a series of URLs that a third party component was handling badly and throwing exceptions.
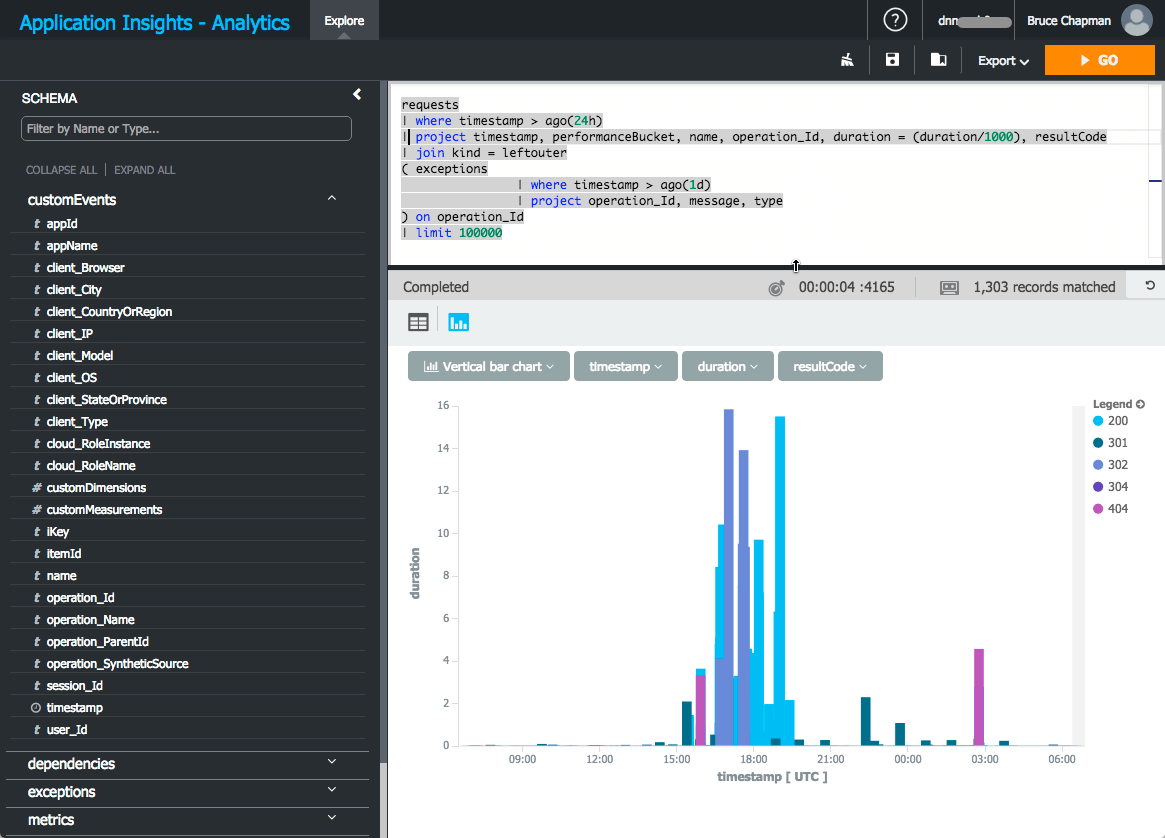
The following example shows the Application Insights Analytics interface, running a query on the assembled log data and graphing it to gain insights. The graphical representation shown here shows a distinct decrease in performance for a period of time, quickly alerting to a timeframe requiring further investigation. By filtering down this time period and combining with exceptions, trace and metrics a much clearer view of the issue can be made.

Above : Screenshot of Application Insights Analytics showing a Bar Chart generated from an query result set
The value of instrumenting your Azure application to output to Application Insights is already clear. Having Application Insights Analytics has provided our DevOps team with a method for filtering, querying and sorting data to gain the true picture of what is happening with our distributed systems. When you’ve become used to looking at all your data in the one place with a single query system, any previous attempt at understanding your system will feel primitive.